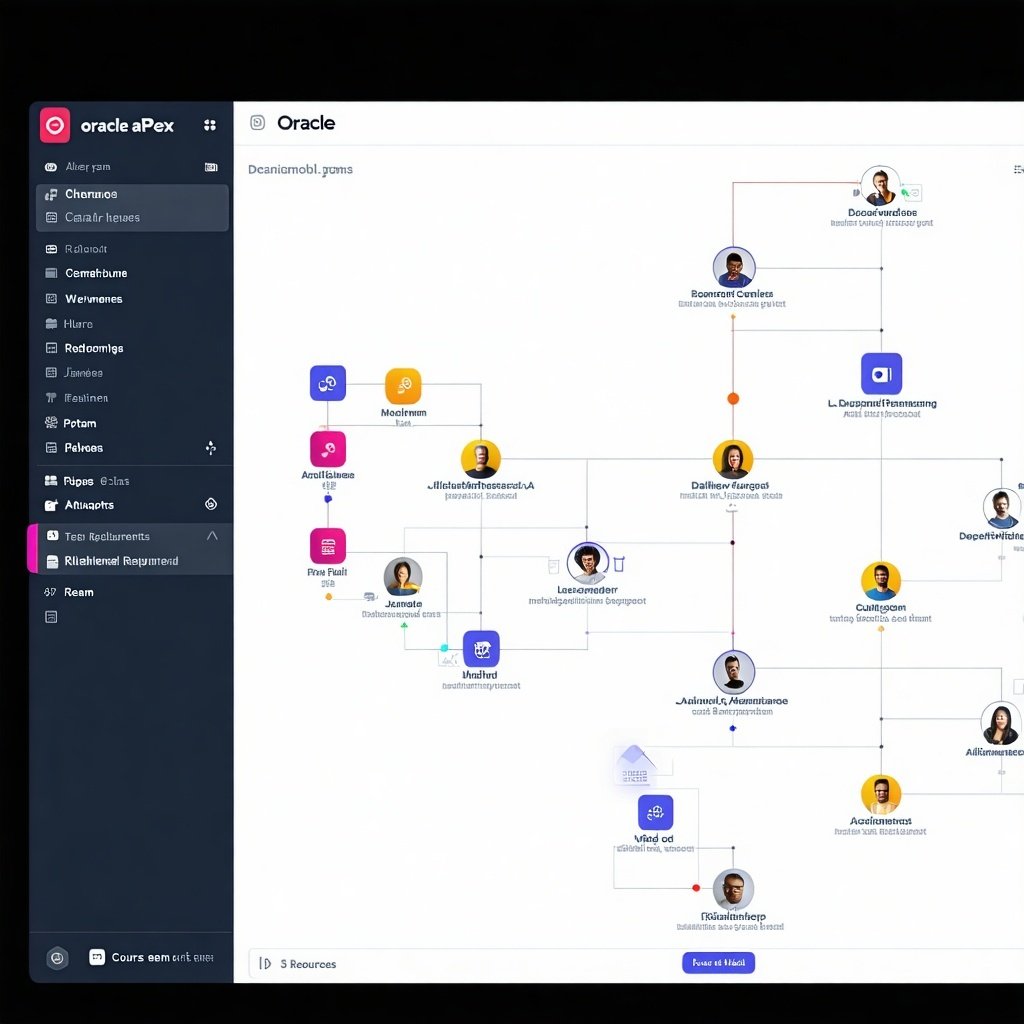
Oracle APEX (Application Express) provides a wide range of visualization options, but one thing it lacks out of the box is interactive organizational charts. That’s where the D3.js JavaScript library comes in.
With D3.js, you can build highly interactive, vector-based charts with zoom and pan functionality — perfect for complex hierarchical data like org charts. In this post, I’ll walk you through how to integrate D3.js into Oracle APEX, generate the necessary JSON payload using PL/SQL, and deliver the data to your JavaScript chart.
Step 1: Include D3.js in Your APEX App
To get started, you need to include D3.js in your APEX application. You can do this via the application’s shared components:
-
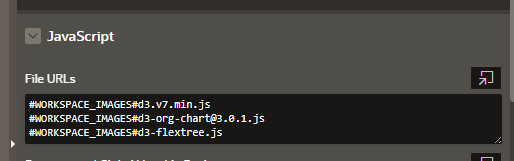
Navigate to: Shared Components > Static Application Files (or Workspace Files)
-
Upload the D3.js library (or use a CDN link)
- The Files to be downloaded from here:
- Save d3-org-chart@3.0.1 with .js extension => d3-org-chart@3.0.1.js
- The Files to be downloaded from here:
-
Then go to your page and add the following in the "File URLs" under the JavaScript section of the Page Attributes:
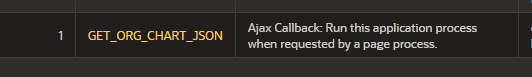
Step 2: Create an Application Process to Generate JSON
To render the org chart, D3.js needs a hierarchical JSON structure. This data should come from your Oracle database. You can generate this via an Application Process in APEX that returns JSON.
Step 3: Build the D3 Org Chart in JavaScript
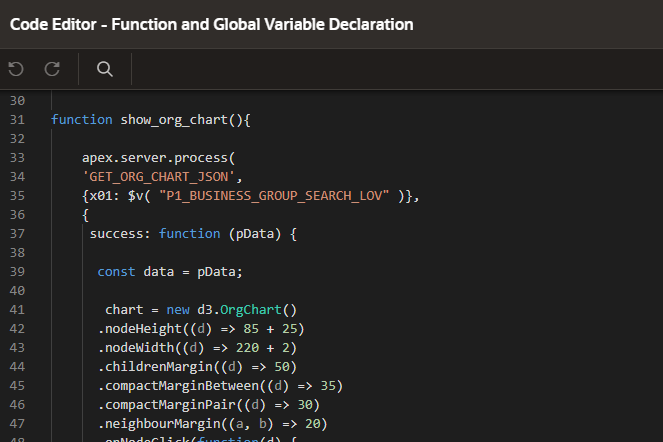
function show_org_chart(){
apex.server.process(
'GET_ORG_CHART_JSON',
{x01: $v( "P1_BUSINESS_GROUP_SEARCH_LOV" )},
{
success: function (pData) {
const data = pData;
chart = new d3.OrgChart()
.nodeHeight((d) => 85 + 25)
.nodeWidth((d) => 220 + 2)
.childrenMargin((d) => 50)
.compactMarginBetween((d) => 35)
.compactMarginPair((d) => 30)
.neighbourMargin((a, b) => 20)
.onNodeClick(function(d) {
if (d.data.url != null) {
window.open(d.data.url);
}
})
.nodeContent(function (d, i, arr, state) {
const color = '#2e85f396';
const imageDiffVert = 25 + 2;
return `
<div style='width:${
d.width
}px;height:${d.height}px;padding-top:${imageDiffVert - 2}px;padding-left:1px;padding-right:1px'>
<div style="font-family: 'Inter', sans-serif;background-color:${color}; margin-left:-1px;width:${d.width - 2}px;height:${d.height - imageDiffVert}px;border-radius:10px;border: 1px solid #E4E2E9">
<div style="display:flex;justify-content:flex-end;margin-top:5px;margin-right:8px">${
d.data.org_short_key
}</div>
<div style="font-size:15px;color:#08011E;margin-left:20px;margin-top:10px"> ${
d.data.name
} </div>
</div>
</div>
`;
})
.container('.chart-container')
.data(data)
.layout('left').render().fit();
}
}
);
}
Step 4: Create Static Content Region
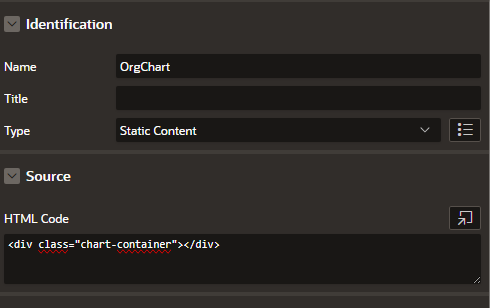
<div class="chart-container"></div>
References
https://stackblitz.com/edit/js-2ct1nt?file=index.html